


Typical roles
You regularly prepare data for reports, dashboards or presentations
You present numbers to management, clients or other teams
You work in analytics, reporting, marketing, product management or consulting

Data alone convinces no one. The story behind it does. In this two-day live online training you learn to turn numbers into clear, honest and impactful visualisations. You choose the right chart type, use colour and layout with intent and build a data story that truly reaches your audience.
In the tecnovy Data Visualisation & Data Storytelling training you turn numbers into clear, honest visualisations and build data stories your audience remembers. The training suits anyone who regularly prepares or presents data.
Two-day live online training with hands-on exercises, held in English
tecnovy’s own curriculum, no external certification scheme
Certificate of participation, no external exam
Dates & booking
No public dates are scheduled yet.
New dates are published regularly. Join the waitlist or plan an in-house course for your team.
Fit
You regularly prepare data for reports, dashboards or presentations
You present numbers to management, clients or other teams
You work in analytics, reporting, marketing, product management or consulting
No prerequisites
You can start right away. What you need: Your own laptop, a stable internet connection and solid workplace English. Helpful: Experience with spreadsheets or data helps but is not required.
Curriculum
Two focused days, one clear structure: on day one you learn to visualise data correctly and effectively. On day two you turn those visuals into stories people remember.
You build the foundation here: you see how people perceive visual information and translate your data into charts that hold up.
Now it is all about impact: you use colour with intent, spot the stories in your data and tell them in a way your audience listens to.
Outcome
You apply key perception principles to your design decisions
You pick the right chart type for your data and your analytical goal
You evaluate visualisations critically and spot common design mistakes
You guide attention deliberately with colour, layout and visual hierarchy
You build charts and simple dashboards with industry standard tools
You build a coherent data story tailored to your audience
You recognise misleading charts and avoid them in your own work
You apply a repeatable workflow from raw data to finished message
After successful participation you receive the tecnovy Certificate of Participation for Data Visualisation & Data Storytelling. It confirms your newly acquired skills, from choosing the right chart type to accessible design and convincing data stories. There is no external exam: no exam registration, no extra fees, no exam stress.
Open the Certificate Showroom tecnovy →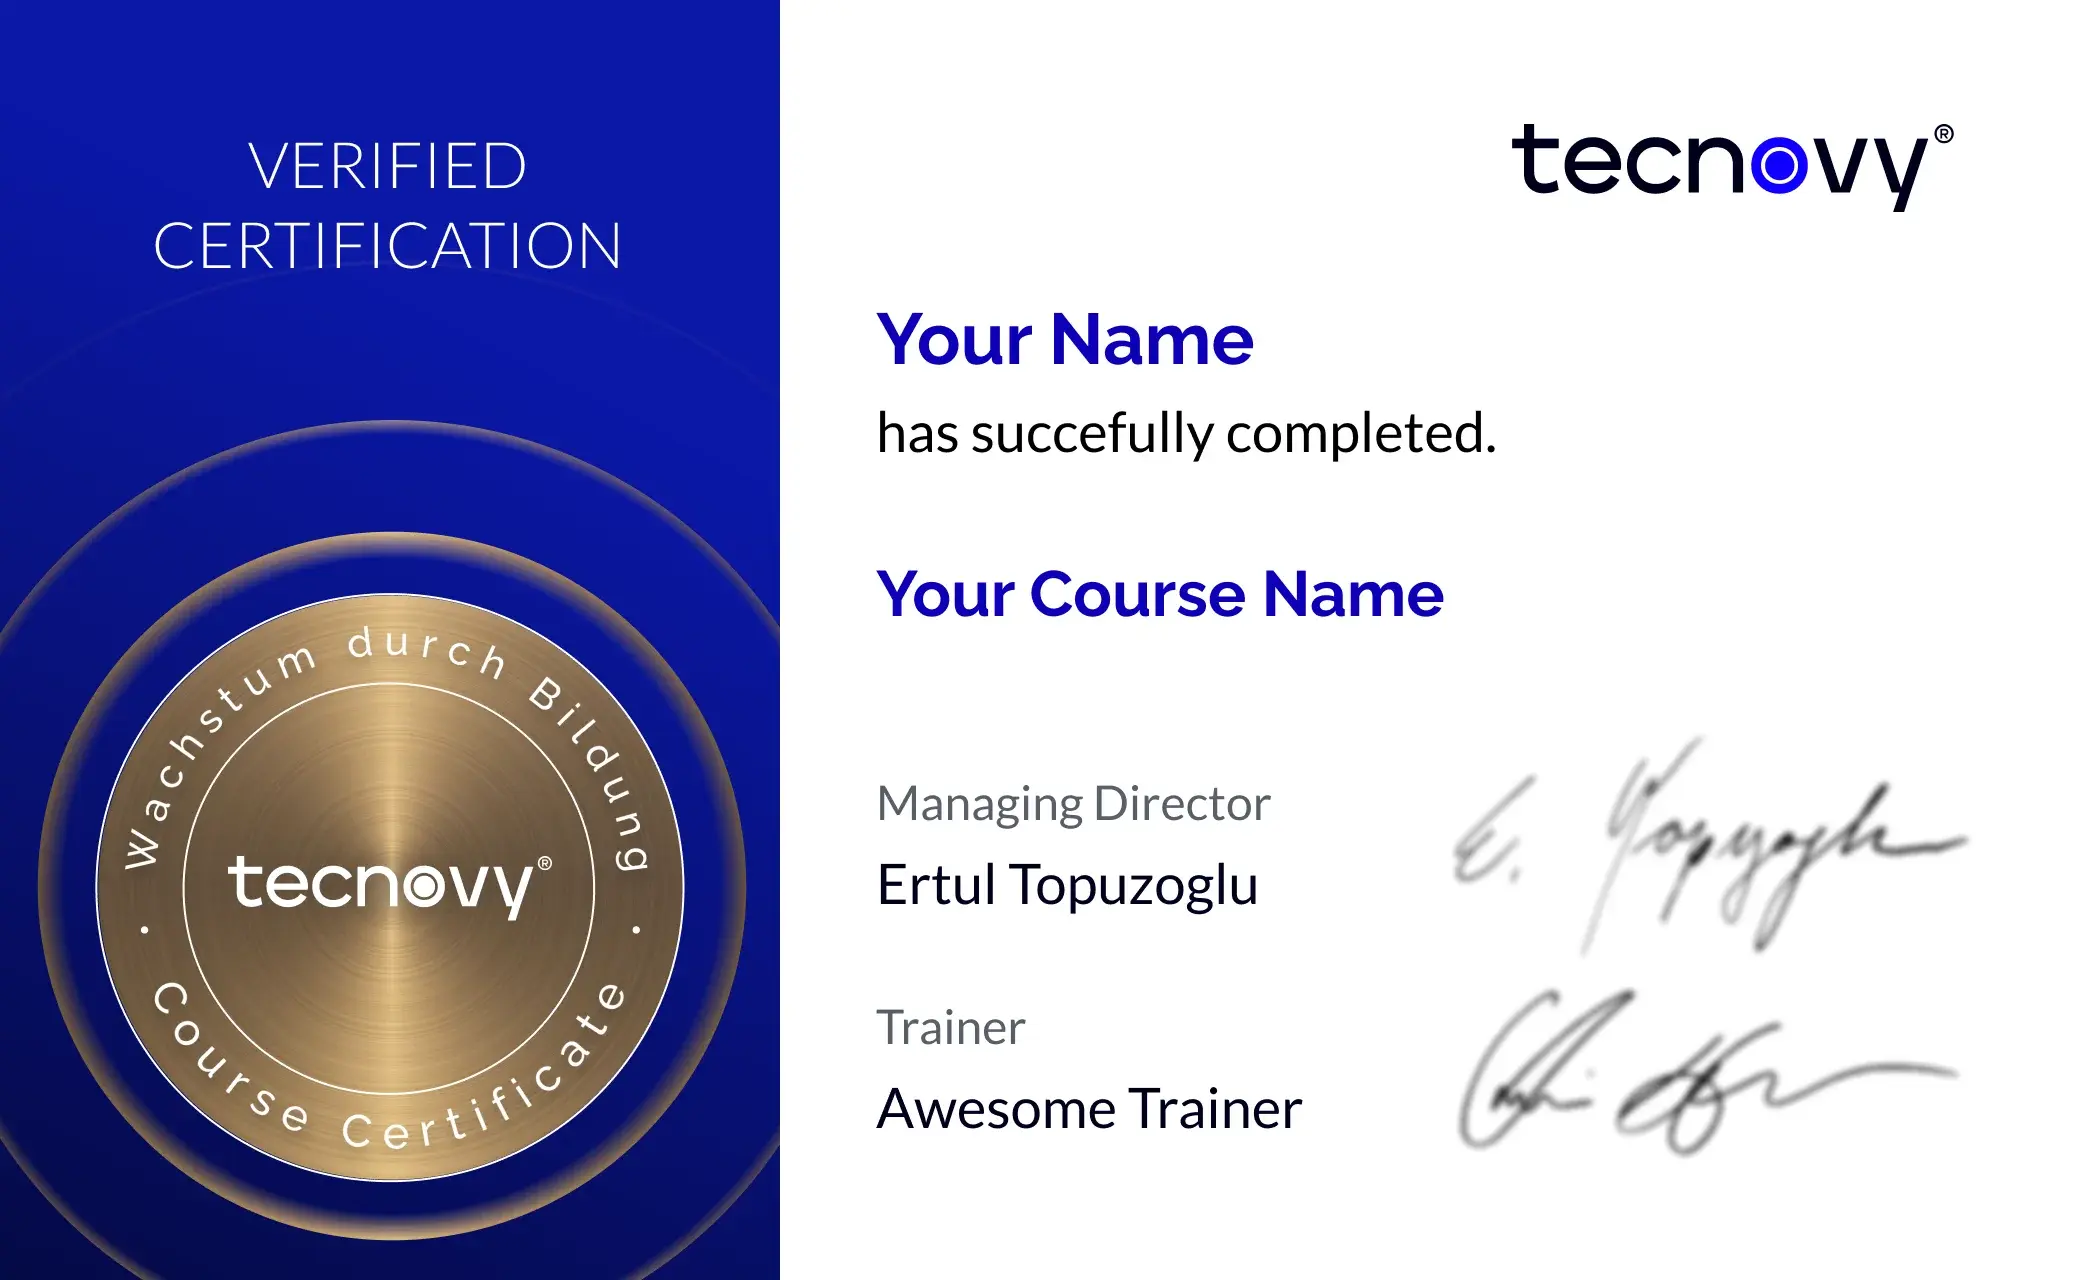
Offer scope
Why tecnovy
01
Promised: no PowerPoint marathon. We work in groups, tie theory to practice, and you get real project examples from our experienced trainers plus the exchange with like-minded people.
02
Get your certificate of participation and, if you have one, add your exam certificate from E-Learning. Fully automated, beautifully designed. Just for you, only at tecnovy.
03
If you are not able to attend the course, you can rebook your training free of charge up to one week before the start of the training.
04
You are welcome to attend the training online again within a year as a refresher.
05
We always guarantee you the use of didactically and methodically first-class qualified trainers who draw their knowledge from training experience as well as professional practical and project experience.
FAQs
In the tecnovy Data Visualisation & Data Storytelling training you learn to visualise data clearly, honestly and responsibly and to turn it into a convincing story: from perception principles to the finished data story.
The tecnovy Data Visualisation & Data Storytelling training is made for anyone who regularly prepares or presents data, for example in analytics, reporting, marketing, product management or consulting.
You need no special prior knowledge for the tecnovy Data Visualisation & Data Storytelling training. Experience with spreadsheets or data helps but is not a requirement.
The tecnovy Data Visualisation & Data Storytelling training runs as a two-day live online course; on request tecnovy delivers it on site. You switch between compact theory sessions and practical hands-on exercises, with plenty of room for questions.
The course language of the tecnovy Data Visualisation & Data Storytelling training is English: slides, exercises and discussions are all in English. Solid workplace English is enough to follow comfortably.
In the tecnovy Data Visualisation & Data Storytelling training you work with common industry standard visualisation tools. tecnovy agrees on the exact tools before the course starts.
For the tecnovy Data Visualisation & Data Storytelling training you need your own laptop and a stable internet connection. That is all.
Yes, after successful participation you receive the tecnovy Certificate of Participation for Data Visualisation & Data Storytelling. There is no external exam; you complete the two days and receive your certificate right away.
Tell us what we can do better next time.
© Copyright 2026, tecnovy GmbH, All Rights Reserved