

1,700 $−170 $1,530 $
What this module delivers.
How the training runs
- Method
- About half hands-on: chart critique, briefing, building, adversarial review
- Basis
- tecnovy's own curriculum, exercises with Claude in the browser
- Outcome
- tecnovy certificate of participation, no examination
Dates & booking
Choose a date that fits
4 dates
Sessions with this symbol offer up to 25% group discount. Click “Details & Registration” to learn more.
1,700 $−170 $1,530 $
1,700 $−170 $1,530 $
1,700 $−170 $1,530 $
No dates match this selection.
Dates are still available. Reset the filters to see them.
Fit
Who this module is designed for
Typical roles
- You prepare analyses, research findings or metrics for an audience that then makes a decision.
- You commission dashboards and reports and sign them off, even if you do not build them yourself.
- Your team already makes charts with AI and finds the output plausible but not quite trustworthy.
Prerequisites
No prerequisites
You can start right away. What you need: your own laptop with an up-to-date browser, a Claude account, working English for the course and the material.
Consider instead Data Visualisation & Data Storytelling If you want visualisation and storytelling with industry-standard tools and no AI focus, that is the course.
Curriculum
Data Visualisation and Storytelling with AI in Detail
Seven parts across two days. Day one is for thinking and designing: criteria, core message, storyboard and a brief worth building from. On day two you build it into an interactive visualisation with Claude, have it attacked and defend it.
01Look before you trust
A summary of data you have not looked at is only a claim.
- Why AI output can look plausible and still be wrong
- Looking at the raw data before you believe an analysis
- The roles in this course: the AI builds, you judge
02Criteria: encoding, chart choice and the four tests
The fundamentals of visualisation become the yardstick for every output.
- Encoding, chart choice, decluttering and colour as evaluation criteria
- The four tests a chart has to pass
- Exercise: critique three flawed charts, first alone, then with AI
- Comparison: what the AI caught, missed and invented
03Audience, stakes and the Big Idea
A good visualisation starts with who has to decide what.
- Clarifying the audience and the stakes of the decision
- The Big Idea: your core message in one sentence
- Finding a defensible story in a dataset
- Checking the story by hand before you tell it
04Storyboard and brief
Day one ends with a brief you can build from.
- Sketching the sequence on paper before any tool comes in
- Writing a creative and technical brief
- Having the model attack the brief and closing the gaps
05Building step by step
Inspect, plan, then build, never the whole thing in one request.
- Checking the data and each intermediate state before the next step
- Building the brief into an interactive visualisation with Claude
- Adding one interaction that earns its place
- Storing your house design principles as a reusable working context
06Adversarial review
Five critics attack your visualisation, and you adjudicate.
- Five roles, instructed to disagree rather than flatter
- Weighing objections: what stands and what does not
- The closing question: what did the critics get wrong?
07Misleading charts, ethics and presenting
Finally you check whether your chart is honest, and present it.
- How charts mislead
- Which of those mistakes an AI makes by default
- Presenting the finished visualisation and defending it under questioning
Outcome
What you will be able to do afterwards
- 01
You assess charts on encoding, chart choice, decluttering and colour, and name what an AI missed or invented.
- 02
You find a defensible story in a dataset and check it by hand before you trust any summary.
- 03
You shape your core message to the audience and the stakes and sketch the sequence as a storyboard on paper.
- 04
You write a creative and technical brief detailed enough for a person or an AI model to build the visualisation from.
- 05
You build your brief step by step with Claude into an interactive visualisation and add one interaction that earns its place.
- 06
You store your house design principles in a reusable working context for the AI.
- 07
You check charts for misleading techniques, especially the ones an AI produces unless told otherwise.
- 08
You weigh the objections of five role-based critics and defend your design decisions in front of the group.
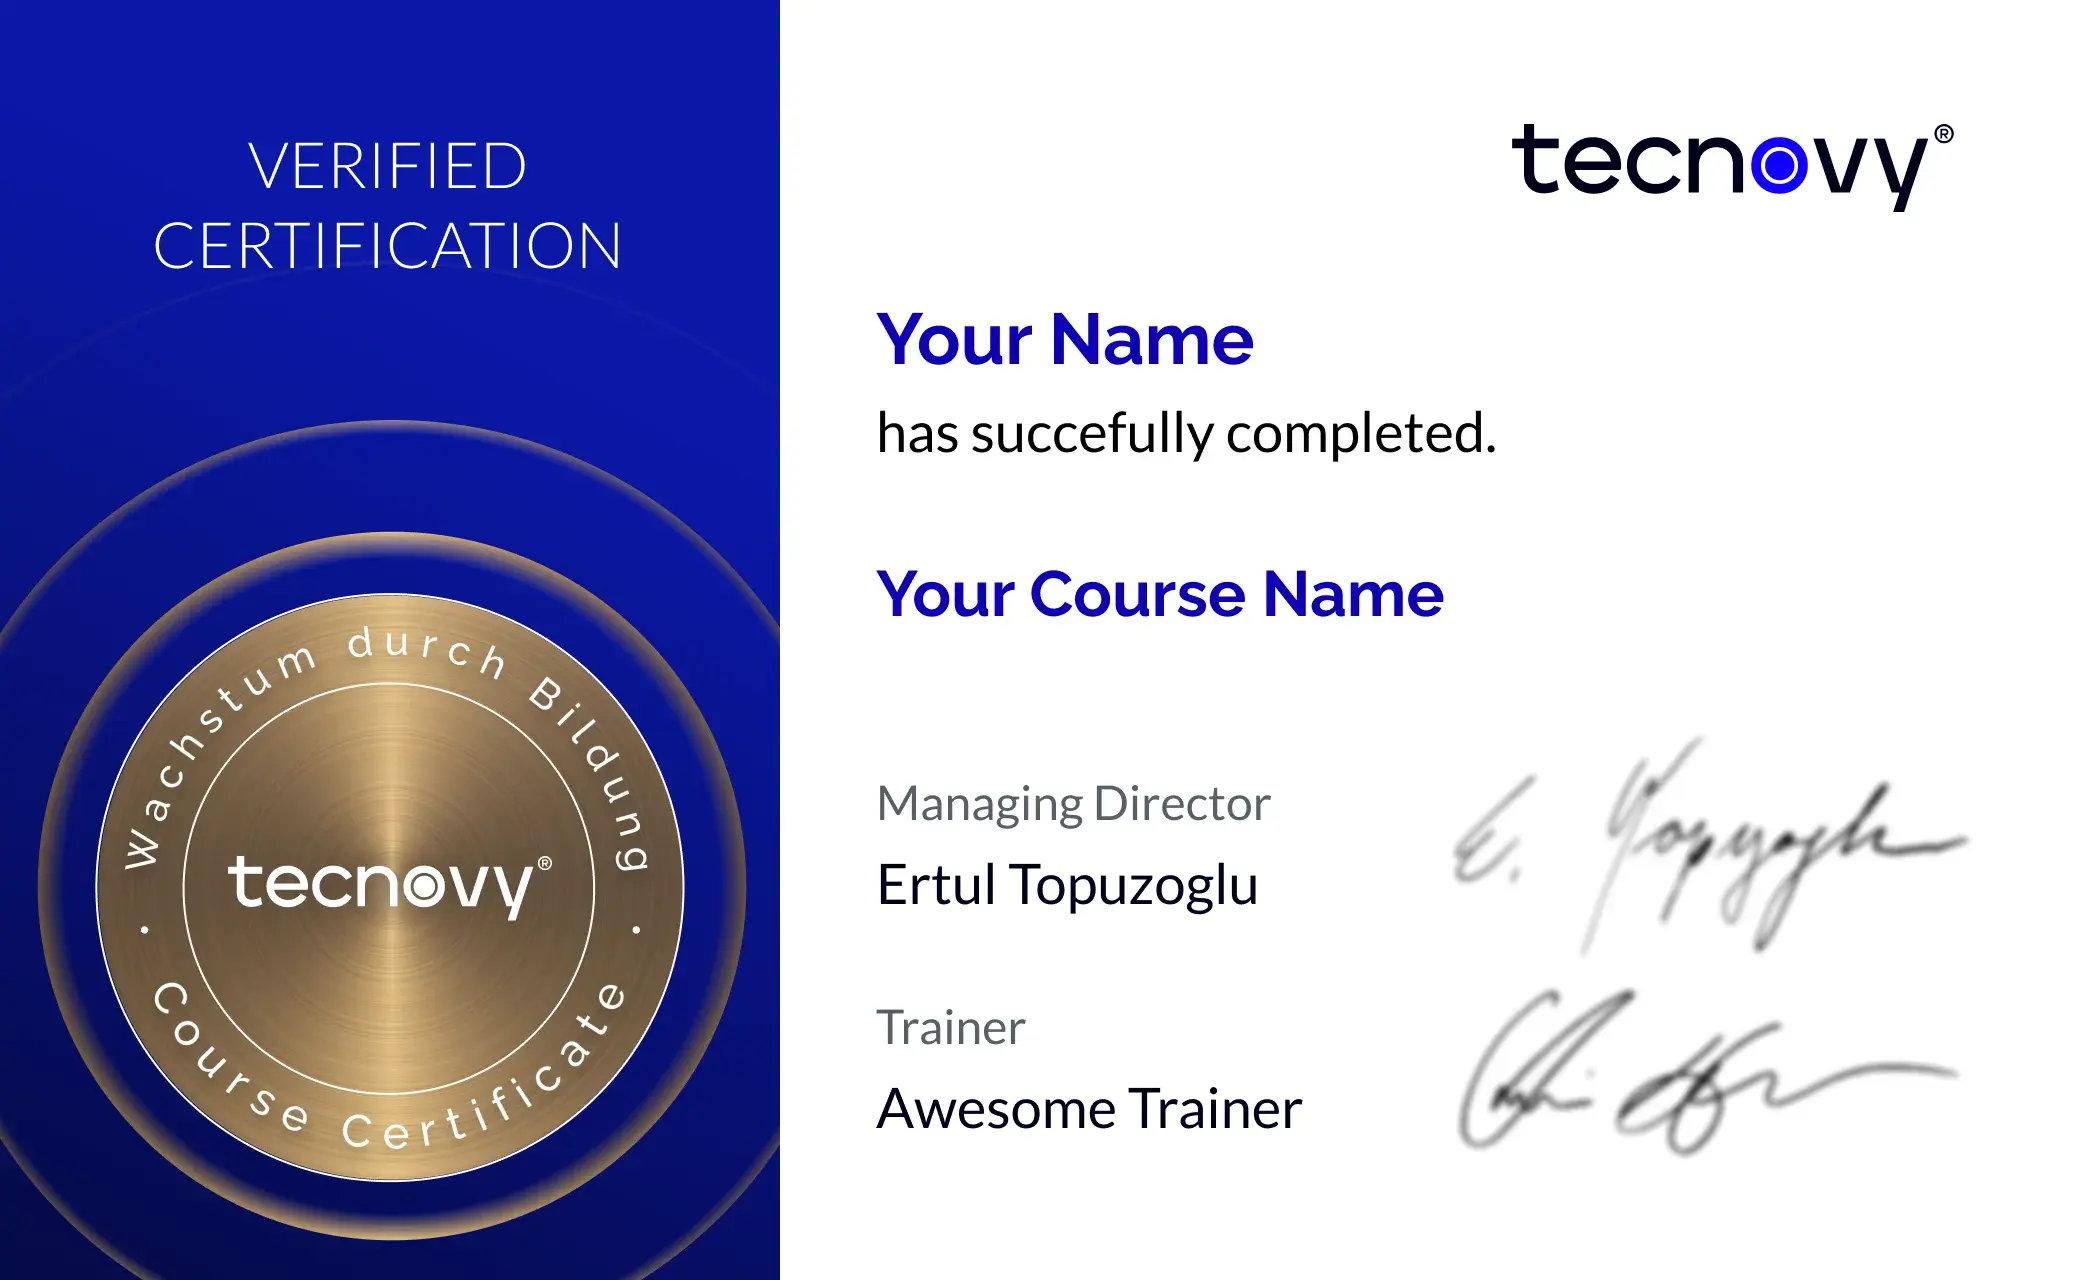
tecnovy Teilnahmezertifikat
Confirms your attendance and the curriculum covered in the training. Issued by tecnovy, shareable on LinkedIn.
Open the Certificate Showroom tecnovy →
Offer scope
What is included
Included
- Nine-part participant workbookWith a brief template, conversation starters, critic role cards, judgement and verification checklists and a chart-choice reference, and it is yours to keep.
- Two synthetic practice datasets with data dictionariesEach holds a real story and planted traps that put your judgement to the test.
- Pre-course setup sheetIt lets you prepare your account and settings before day one.
Why tecnovy
What you get on top with us
01
No Slideshow, Hands-On!
Promised: no PowerPoint marathon. We work in groups, tie theory to practice, and you get real project examples from our experienced trainers plus the exchange with like-minded people.
02
Certificate Showroom
Get your certificate of participation and, if you have one, add your exam certificate from E-Learning. Fully automated, beautifully designed. Just for you, only at tecnovy.
03
Flexible Date Change
If you are not able to attend the course, you can rebook your training free of charge up to one week before the start of the training.
04
Attend Twice, Pay Once
You are welcome to attend the training online again within a year as a refresher.
05
Learn from Experts
We always guarantee you the use of didactically and methodically first-class qualified trainers who draw their knowledge from training experience as well as professional practical and project experience.
FAQs
Frequently asked questions
01What language is the course in?
02Will I learn prompts for charts?
03Do I need to be able to code?
04Which account do I need, and is the free plan enough?
05Can I work with my own data?
06What happens in the adversarial review?
07How does this course differ from Data Visualisation & Data Storytelling?
08What do I receive at the end?
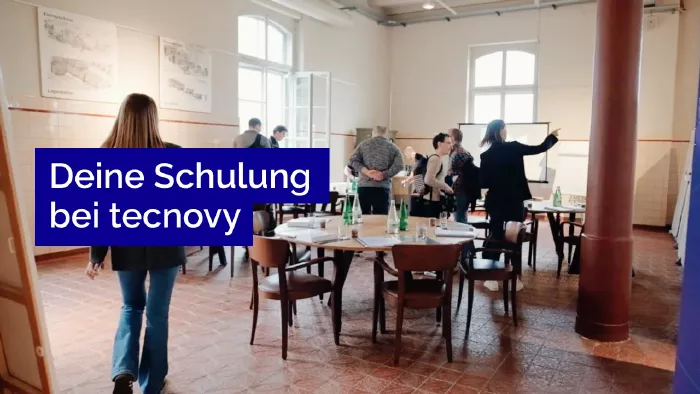
What does your training at tecnovy look like?